Math Animation Software: Choose Your Workflow
Compare hand-written Manim scenes, visual editors, and agent-assisted workflows. Start with the explanation you need to make.
Start with the explanation you need
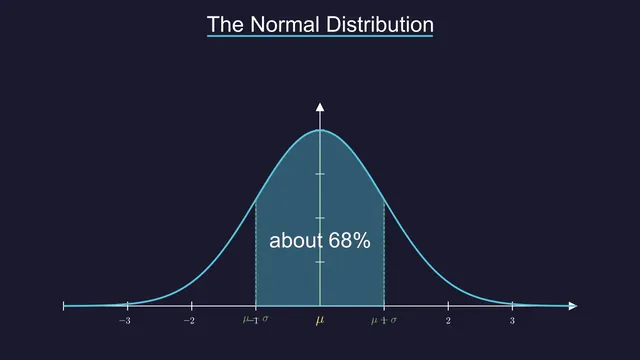
Choosing math animation software starts with a teaching decision: what should change on screen, and what should a viewer understand after seeing it? A probability curve filling with color, a formula appearing term by term, and a table comparing measurements need different visual treatments. Movement earns its place when it reveals a relationship that a still slide leaves unclear.
Write down one learning objective before choosing a tool. For a first lesson on a normal distribution, that might be “connect the shaded area to the proportion of observations.” For a hypothesis test, it might be “compare observed counts with the counts a model predicts.” A short, specific objective makes both manual work and an agent-generated storyboard easier to evaluate.
Three ways to make mathematical animation
| Approach | A good fit when | What you take on |
|---|---|---|
| Write Manim scenes in Python | You need detailed control of objects, timing, and mathematical constructions | Programming, scene debugging, rendering setup, and a separate narration workflow |
| Use slides or a general video editor | You mostly need diagrams, labels, transitions, and footage arranged visually | Manual layout and timing; mathematical notation may need separate preparation |
| Let an AI agent plan a supported rendering workflow | You want to begin with readable notes or a description and iterate through conversation | Reviewing the storyboard, preparing local dependencies, and checking the resulting explanation |
None of these routes removes the need to understand the material. A custom Python scene offers freedom, but also more code to maintain. A visual editor can make small timing adjustments straightforward, while a complicated formula sequence may take more manual assembly. An agent can propose a story quickly, but its first explanation can still have missing assumptions or incorrect numbers.
Where Manim Community fits
Manim Community is an open-source Python library for creating mathematical animations. Its scene model lets an author define objects and transformations in code. It is useful when the relationship between a formula, graph, and annotation matters more than decorative motion. The community project and the version maintained by 3Blue1Brown are separate; examples written for one may need changes to work in the other. See the Manim Community project FAQ before choosing tutorials or installing packages.
LemmaReel uses Manim Community as its rendering engine. It adds a storyboard workflow and built-in visual templates around that engine. Your existing coding agent plans the explanation; local rendering and English narration produce the video. The current LemmaReel build is verified on Apple Silicon Macs, requires local rendering dependencies, and outputs an MP4 rather than an editable video-editor timeline. Agent model usage is separate from the software purchase; whether a subscription is needed depends on your provider. This is one option in the agent-assisted category, not a replacement for everything you can build directly in Python. For detailed product information, visit the LemmaReel math animation homepage.
Compare tools with one small scene
Instead of comparing feature counts, try the same explanation in each workflow. For a normal curve, specify the center, the scale, the region to shade, the label, and the sentence the audience should hear. Check that the shaded interval and spoken description agree. Then change the scale and see how much work the revision takes.
Inspect the result at the size where people will watch it. Axis labels that look comfortable on a large monitor may be too small in a course player. A well-rendered formula can still disappear before a student has time to read it. Watch once without sound and listen once without watching: both passes help reveal whether the visual sequence and narration support each other.
Explore two statistical examples
The chi-square test explainer follows counts, expected values, and the test statistic. It is a useful example of an animation that should make a calculation visible rather than simply display an answer. The ANOVA explainer distinguishes variation between group means from variation inside groups, then explains why a significant overall result does not identify every differing pair.
These examples are illustrations, not a substitute for checking a study design. Choose mathematical animation software that lets you make assumptions visible, correct mistakes, and revisit the same story when your audience needs a clearer explanation. If your starting point is a written lesson rather than a scene in code, the notes-to-video workflow shows how to organize that material first.